On The Rise: Housing Markets Most At-Risk for Climate Change
Is climate change shifting buyer priorities in real estate markets across the United States?
As the effects of climate change grow increasingly prevalent, they become harder and harder to ignore, especially when making a significant investment like buying a house. The National Resource Defense Council (NDRC) reported in 2019 that rising sea levels will be a significant driving force in displacing populations globally. In fact, the NDRC estimates that between 4.2 and 13.1 million Americans could be forced to move due to climate change by the end of the twenty-first century; countless miles of land in the United States will become unlivable within the next 80 years.
Individuals on the market for buying a house in the United States have reported varying levels of concern about how climate change may affect where they choose to live. A recent report from the New York Times detailed a decline in property sales in high-risk areas in Florida following 2013, when the aftermath of Hurricane Sandy left many potential buyers reeling after witnessing the tangible effects of climate change. However, the housing market landscape in at-risk areas varies throughout the country. In some cities, home sales are virtually unimpeded by the impending possibility of sea level rise. According to a November 2020 report by Politico, lenders have continued to issue mortgages in these at-risk neighborhoods without hesitation, indicating that movement into these regions is still active. The subsidization of these risky properties is cause for concern for climate scientists and economists alike, because the overvaluation of homes in these risky areas could lead to the devaluation of property, potentially prompting a major housing crisis. Many economic and regional planning experts have called on the government to enact stricter regulations that account for the effects of climate change in higher-risk areas in order to prevent a widespread housing crisis and bolster protection for vulnerable populations.
We are past the tipping point when it comes to reckoning with climate change. Sea level rise, flood, and wildfires are all current realities across the country, and will only continue to shape the future of where we build our communities. To understand how the effects of climate change may impact real estate markets in the United States, the research team at Insurify consulted data from the University of Notre Dame to identify cities whose housing markets are most at risk for climate change.
Insights
- National averages. Out of the 280 U.S. cities surveyed, the average Overall Climate Change Risk Level Score is 42.05 out of 100. The average flood risk is 38.26 out of 100, and the average drought risk is 46.01 out of 100. Across metropolitan areas in the United States, designated by Redfin as combined statistical areas with at least 500 users, the median sale price of homes on the market grew by 22.71 percent year-over-year, as of October 2020. Likewise, the number of homes sold year-over-year as of October 2020 increased by 27.44 percent.
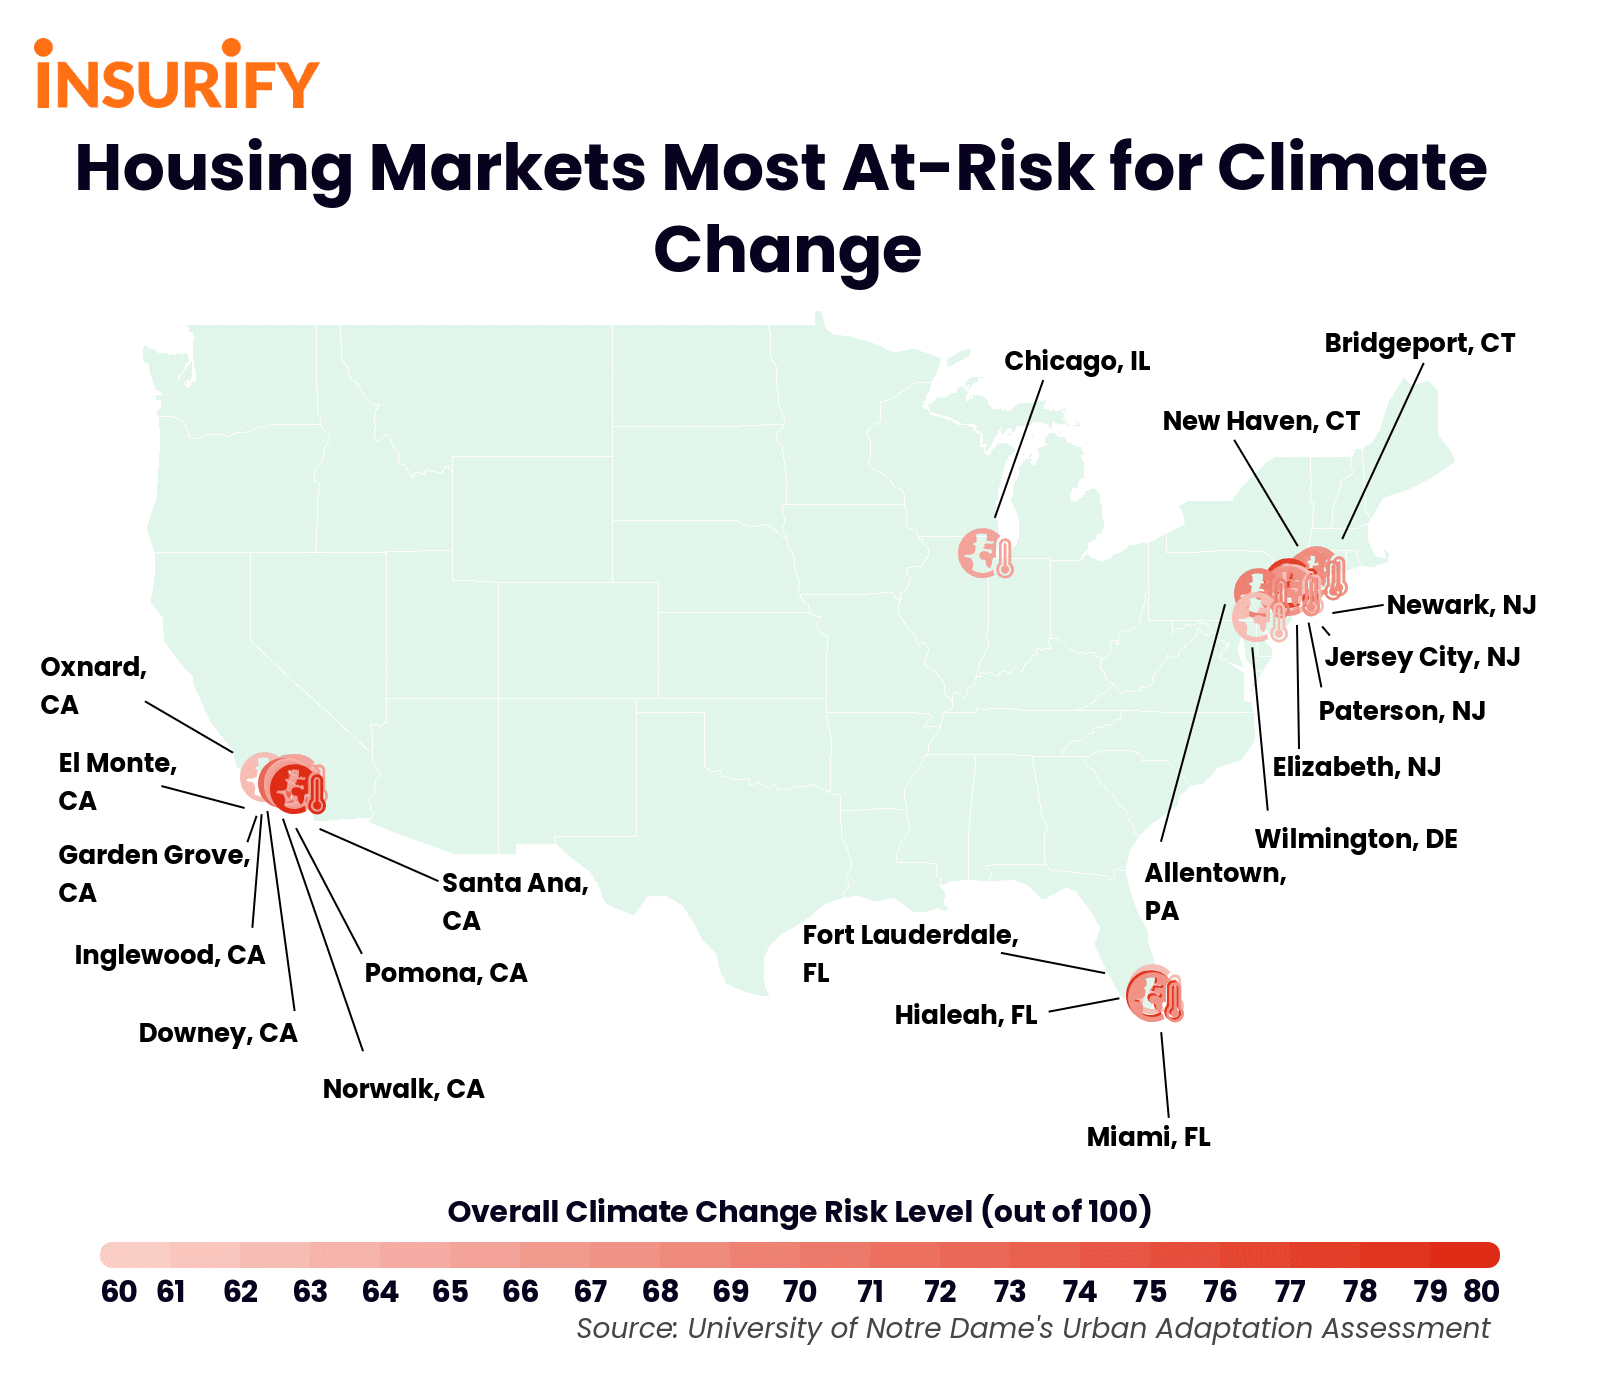
- Coastal cities are at the highest risk. Perhaps unsurprisingly, the twenty cities whose housing markets are most susceptible to the effects of climate change are coastal, with the notable exception of Chicago. While Chicago is not on an oceanic coast, it is on the coastline of Lake Michigan, leaving the city susceptible to similar outcomes as cities on an ocean shoreline. Coastal cities are more at risk than inland cities, according to the World Economic Forum. Increasing temperatures cause sea level rise, which contributes to flooding, erosion, and saltwater intrusion into surface and groundwaters. The urgent impact of these climate change hazards means that cities on the coast are seeing the effects of global warming more immediately than non-coastal cities. However, landlocked cities are not impervious to the effects of climate change. In fact, climate scientists have predicted that inland migration will increase as rising sea levels continue to affect more shoreline communities. One study from the University of Southern California projects that popular cities for relocation may be such inland metropolitan areas as Atlanta, Houston, Dallas, Denver, and Las Vegas.
- Home sales still grew over the past year. All 20 cities on the list have one thing in common: year-over-year positive increases for home sales and home prices. However, for many of the cities on the list, the growth on both of these metrics does not exceed the national average. The pandemic has certainly changed the landscape of home buying in the United States in 2020, driving sales in suburban and rural areas at unprecedented levels. However, on the yearly long-term scale, none of these cities have experienced a relative decline in their home sales or market prices, according to the data from October 2020. It’s important to note the difference between relative growth and rate of growth — while these cities experienced positive year-over-year growth between 2019 and 2020, the rate at which home sales or prices changed may not necessarily have been positive.
Methodology
To identify the housing markets most susceptible to the effects of climate change, the data science team at Insurify referred to two publicly available data sources. Overall climate change risk level for each city was derived from the University of Notre Dame’s Urban Adaptation Assessment, launched by the Notre Dame Global Adaptation Initiative in 2018. The Urban Adaptation Assessment includes data and risk calculations for climate change hazards (heat, cold, floods, droughts, and sea level rise) and the economic, social, and governance measures in place to combat them in 280 U.S. cities across 48 states. The Overall Climate Change Risk score, which is the basis for the rankings’ order, was calculated by the UAA by taking the average of each city’s scores of each hazard.
The second source used by Insurify’s data scientists is Redfin’s Housing Market Data. Redfin, a national real estate brokerage, collects real estate market metrics on a monthly basis across multiple geographic levels in the United States. The relative growth of median sale prices of homes and of the number of homes sold year-over-year for each city on the list are taken from Redfin’s most recent year-over-year estimates as of October 2020. For some noted cities on the list, the growth of median sale price and of the number of homes sold year-over-year were taken from that city’s greater metropolitan area.

Housing Markets Most At-Risk for Climate Change
20. Wilmington, DE
- Overall Climate Change Risk Level: 61.71 out of 100
- Flood risk: 55.82 out of 100
- Drought risk: 64.67 out of 100
- Median Home Sale Price Growth (YoY): +13.4%
- Home Sales Rate (YoY): +32.8%
19. Oxnard, CA
- Overall Climate Change Risk Level: 61.73 out of 100
- Flood risk: 42.59 out of 100
- Drought risk: 77.76 out of 100
- Median Home Sale Price Growth (YoY): +12.4%
- Home Sales Rate (YoY): +12.2%
18. Fort Lauderdale, FL
- Overall Climate Change Risk Level: 61.94 out of 100
- Flood risk: 77.90 out of 100
- Drought risk: 45.31 out of 100
- Median Home Sale Price Growth (YoY): +11.5%
- Home Sales Rate (YoY): +16.4%
17. Jersey City, NJ
- Overall Climate Change Risk Level: 62.36 out of 100
- Flood risk: 46.95 out of 100
- Drought risk: 78.39 out of 100
- Median Home Sale Price Growth (YoY)*: +10.0%
- Home Sales Rate (YoY)*: +17.8%
16. Downey, CA
- Overall Climate Change Risk Level: 63.09 out of 100
- Flood risk: 30.73 out of 100
- Drought risk: 82.52 out of 100
- Median Home Sale Price Growth (YoY)**: +14.0%
- Home Sales Rate (YoY)**: +12.1%
15. Pomona, CA
- Overall Climate Change Risk Level: 64.56 out of 100
- Flood risk: 57.81 out of 100
- Drought risk: 68.27 out of 100
- Median Home Sale Price Growth (YoY)**: +14.0%
- Home Sales Rate (YoY)**: +12.1%
14. Chicago, IL
- Overall Climate Change Risk Level: 64.75 out of 100
- Flood risk: 28.88 out of 100
- Drought risk: 72.79 out of 100
- Median Home Sale Price Growth (YoY): +14.4%
- Home Sales Rate (YoY): +33.2%
13. Norwalk, CA
- Overall Climate Change Risk Level: 65.16 out of 100
- Flood risk: 32.07 out of 100
- Drought risk: 66.69 out of 100
- Median Home Sale Price Growth (YoY)**: +14.0%
- Home Sales Rate (YoY)**: +12.1%
12. El Monte, CA
- Overall Climate Change Risk Level: 65.17 out of 100
- Flood risk: 25.14 out of 100
- Drought risk: 75.31 out of 100
- Median Home Sale Price Growth (YoY)**: +14.0%
- Home Sales Rate (YoY)**: +12.1%
11. Garden Grove, CA
- Overall Climate Change Risk Level: 66.37 out of 100
- Flood risk: 38.23 out of 100
- Drought risk: 71.64 out of 100
- Median Home Sale Price Growth (YoY)**: +14.0%
- Home Sales Rate (YoY)**: +12.1%
10. Newark, NJ
- Overall Climate Change Risk Level: 66.56 out of 100
- Flood risk: 47.94 out of 100
- Drought risk: 57.73 out of 100
- Median Home Sale Price Growth (YoY): +23.5%
- Home Sales Rate (YoY): +29.2%
9. Miami, FL
- Overall Climate Change Risk Level: 66.65 out of 100
- Flood risk: 68.31 out of 100
- Drought risk: 54.89 out of 100
- Median Home Sale Price Growth (YoY): +12.9%
- Home Sales Rate (YoY): +8.6%
8. Elizabeth, NJ
- Overall Climate Change Risk Level: 66.85 out of 100
- Flood risk: 43.95 out of 100
- Drought risk: 81.38 out of 100
- Median Home Sale Price Growth (YoY)*: +10.0%
- Home Sales Rate (YoY)*: +17.8%
7. New Haven, CT
- Overall Climate Change Risk Level: 66.86 out of 100
- Flood risk: 66.69 out of 100
- Drought risk: 73.20 out of 100
- Median Home Sale Price Growth (YoY): +18.6%
- Home Sales Rate (YoY): +52.9%
6. Bridgeport, CT
- Overall Climate Change Risk Level: 68.10 out of 100
- Flood risk: 61.66 out of 100
- Drought risk: 80.84 out of 100
- Median Home Sale Price Growth (YoY): +39.4%
- Home Sales Rate (YoY): +71.3%
5. Allentown, PA
- Overall Climate Change Risk Level: 68.66 out of 100
- Flood risk: 54.79 out of 100
- Drought risk: 72.07 out of 100
- Median Home Sale Price Growth (YoY): +15.6%
- Home Sales Rate (YoY): +24.0%
4. Inglewood, CA
- Overall Climate Change Risk Level: 71.79 out of 100
- Flood risk: 32.70 out of 100
- Drought risk: 80.41 out of 100
- Median Home Sale Price Growth (YoY)**: +14.0%
- Home Sales Rate (YoY)**: +12.1%
3. Paterson, NJ
- Overall Climate Change Risk Level: 77.22 out of 100
- Flood risk: 70.62 out of 100
- Drought risk: 68.39 out of 100
- Median Home Sale Price Growth (YoY)*: +10.0%
- Home Sales Rate (YoY)*: +17.8%
2. Hialeah, FL
- Overall Climate Change Risk Level: 78.09 out of 100
- Flood risk: 84.40 out of 100
- Drought risk: 86.17 out of 100
- Median Home Sale Price Growth (YoY)***: +12.9%
- Home Sales Rate (YoY)***: +8.6%
1. Santa Ana, CA
- Overall Climate Change Risk Level: 79.64 out of 100
- Flood risk: 54.90 out of 100
- Drought risk: 86.17 out of 100
- Median Home Sale Price Growth (YoY)**: +14.0%
- Home Sales Rate (YoY)**: +12.1%
*Estimates from the greater New York-NJ Metro Area
**Estimates from the greater Los Angeles Metro Area
***Estimate from the greater Miami Metro Area
If you have any questions or comments about this article, or would like to request the data, please contact insights@insurify.com.
More From HOT 99.1