Hang Up the Keys: Cities With the Most Suspended Driver’s Licenses
You are in the middle of a long drive, perhaps a road trip, and your mind is wandering—either admiring the scenery or bored by the monotony of the interstate highway.
All of a sudden, though, the blaring sound of a siren brings you back to reality. As it turns out, you have been driving 75 miles per hour—well over the legal speed limit. You accept the traffic ticket, pay it off later, and think nothing of it.
That is, until the same thing happens three more times in the next six months, and you receive notice that your driver’s license has been suspended. Of course, there are more ways than one to get your license temporarily revoked. Speeding is one, but drug and alcohol-related infractions or more serious offenses like hit-and-runs can also do the trick. Suspension can be costly—you can’t drive with a suspended license, for one, and to be able to hit the roads again you have to pay a fee—but the financial impact of having your license temporarily suspended goes beyond that. The infraction goes on your driving record and can lead to higher insurance rates.
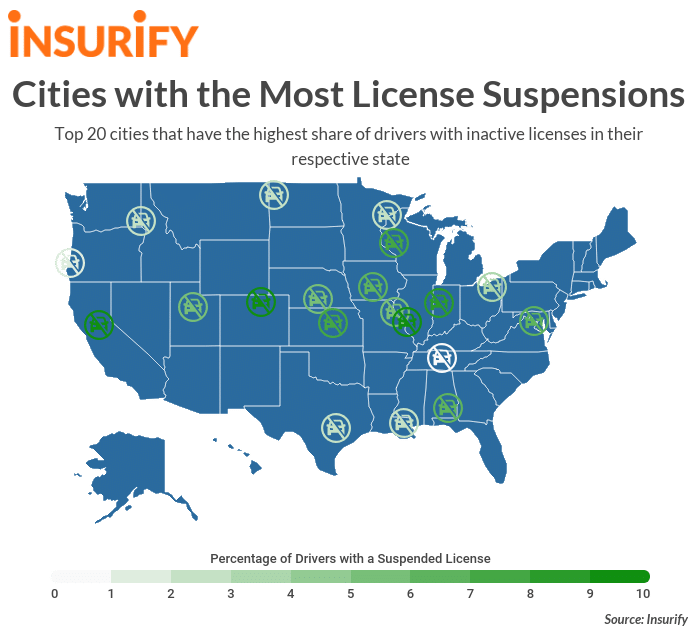
To take a deeper look at suspended license rates, the data science team at Insurify, an auto insurance quotes comparison site, ran the numbers to determine which areas nationwide had the highest percentage of drivers with a suspended license.
Insights
- National averages. In the United States, an average of 2.59 percent of drivers reported having a suspended license. Nationally, 22.32 percent of drivers reported having committed at least one traffic violation. Drivers with suspended licenses are also more likely to be involved in fatal accidents. According to a study done in 2014 by the National Highway Traffic Safety Administration (NHTSA), drivers with invalid licenses comprised 13 percent of all motorists involved in fatal crashes.
- Where it rains, it pours…license suspensions. Among the top 15 cities with the highest rates of suspended licenses nationwide, there were three states that made frequent appearances. Indiana had three cities that came in ninth, 13th, and 15th, respectively. That being said, it wasn’t even the state with the most cities ranking within the top 15. Ohio was home to four different cities at the top of the list, and those cities held the third, fourth, 12th, and 14th places. Virginia also saw four cities crack the top 15. Those cities slotted in at number one, six, seven, and 10 on the list.
- More drivers doesn’t equal more suspended licenses. From the database, researchers identified the city in each of the 50 states (plus Washington, D.C.) with the highest percentage of drivers with suspended licenses. However, there is no significant correlation between the population of the city and the proportion of drivers with temporarily rescinded licenses. Take, for example, Phoenix and Detroit, which were the two most populous cities among those with the most license suspensions in their respective states. Overall, both of these cities ranked near the bottom of the list of cities with the most suspended licenses in their states.
Methodology
To investigate the cities with the most license suspensions, the data scientists at Insurify, a website to compare car insurance quotes, analyzed their database of over 1.6 million car insurance applications. Applicants provide information about themselves, their vehicle, and their driver history, including whether their license was active or suspended. The proportion of car owners with suspended licenses was analyzed against the total number of drivers in the city to determine the ranking. Then, the city with the highest percentage in each state was selected. The top 20 are reported here. Data about the percentage of drivers with a prior driving violation was also gathered from the Insurify database, while information about drivers involved in fatal crashes came from a 2014 study done by the NHTSA entitled “Driver License Compliance Status in Fatal Crashes.”

20. Payson, Utah
- Percentage of drivers with a suspended license: 5.81%
- Percentage of drivers with a prior driving violation: 41.29%
- Percentage of fatal crash drivers with an invalid license state-wide: 15%
19. Troy, Alabama
- Percentage of drivers with a suspended license: 6.14%
- Percentage of drivers with a prior driving violation: 20.35%
- Percentage of fatal crash drivers with an invalid license state-wide: 13%
18. Eau Claire, Wisconsin
- Percentage of drivers with a suspended license: 6.21%
- Percentage of drivers with a prior driving violation: 30.51%
- Percentage of fatal crash drivers with an invalid license state-wide: 14%
17. Duluth, Minnesota
- Percentage of drivers with a suspended license: 6.33%
- Percentage of drivers with a prior driving violation: 22.67%
- Percentage of fatal crash drivers with an invalid license state-wide: 9%
16. Bastrop, Texas
- Percentage of drivers with a suspended license: 6.59%
- Percentage of drivers with a prior driving violation: 16.48%
- Percentage of fatal crash drivers with an invalid license state-wide: 18%
15. Des Moines, Iowa
- Percentage of drivers with a suspended license: 6.65%
- Percentage of drivers with a prior driving violation: 29.82%
- Percentage of fatal crash drivers with an invalid license state-wide: 12%
14. Hammond, Louisiana
- Percentage of drivers with a suspended license: 6.74%
- Percentage of drivers with a prior driving violation: 18.54%
- Percentage of fatal crash drivers with an invalid license state-wide: 14%
13. Coos Bay, Oregon
- Percentage of drivers with a suspended license: 7.11%
- Percentage of drivers with a prior driving violation: 19.82%
- Percentage of fatal crash drivers with an invalid license state-wide: 13%
12. La Vergne, Tennessee
- Percentage of drivers with a suspended license: 7.18%
- Percentage of drivers with a prior driving violation: 24.86%
- Percentage of fatal crash drivers with an invalid license state-wide: 13%
11. Hannibal, Missouri
- Percentage of drivers with a suspended license: 7.49%
- Percentage of drivers with a prior driving violation: 32.62%
- Percentage of fatal crash drivers with an invalid license state-wide: 12%
10. Alton, Illinois
- Percentage of drivers with a suspended license: 7.55%
- Percentage of drivers with a prior driving violation: 22.64%
- Percentage of fatal crash drivers with an invalid license state-wide: 8%
9. Kearney, Nebraska
- Percentage of drivers with a suspended license: 8.00%
- Percentage of drivers with a prior driving violation: 25.71%
- Percentage of fatal crash drivers with an invalid license state-wide: 5%
8. Windsor, Colorado
- Percentage of drivers with a suspended license: 8.18%
- Percentage of drivers with a prior driving violation: 35.22%
- Percentage of fatal crash drivers with an invalid license state-wide: 17%
7. Lewiston, Idaho
- Percentage of drivers with a suspended license: 8.23%
- Percentage of drivers with a prior driving violation: 29.11%
- Percentage of fatal crash drivers with an invalid license state-wide: 8%
6. Salina, Kansas
- Percentage of drivers with a suspended license: 8.59%
- Percentage of drivers with a prior driving violation: 21.72%
- Percentage of fatal crash drivers with an invalid license state-wide: 13%
5. Lafayette, Indiana
- Percentage of drivers with a suspended license: 9.89%
- Percentage of drivers with a prior driving violation: 28.02%
- Percentage of fatal crash drivers with an invalid license state-wide: 14%
4. Orangevale, California
- Percentage of drivers with a suspended license: 10.0%
- Percentage of drivers with a prior driving violation: 28.82%
- Percentage of fatal crash drivers with an invalid license state-wide: 18%
3. Euclid, Ohio
- Percentage of drivers with a suspended license: 11.97%
- Percentage of drivers with a prior driving violation: 34.62%
- Percentage of fatal crash drivers with an invalid license state-wide: 11%
2. Williston, North Dakota
- Percentage of drivers with a suspended license: 13.50%
- Percentage of drivers with a prior driving violation: 34.55%
- Percentage of fatal crash drivers with an invalid license state-wide: 17%
1. Reston, Virginia
- Percentage of drivers with a suspended license: 14.69%
- Percentage of drivers with a prior driving violation: 26.42%
- Percentage of fatal crash drivers with an invalid license state-wide: 8%
More From HOT 99.1


![Move Over April The Giraffe: It’s Bethlehem Library’s Baby Chick Watch [LIVE]](http://townsquare.media/site/81/files/2019/06/Chick-Watch.jpg?w=980&q=75)